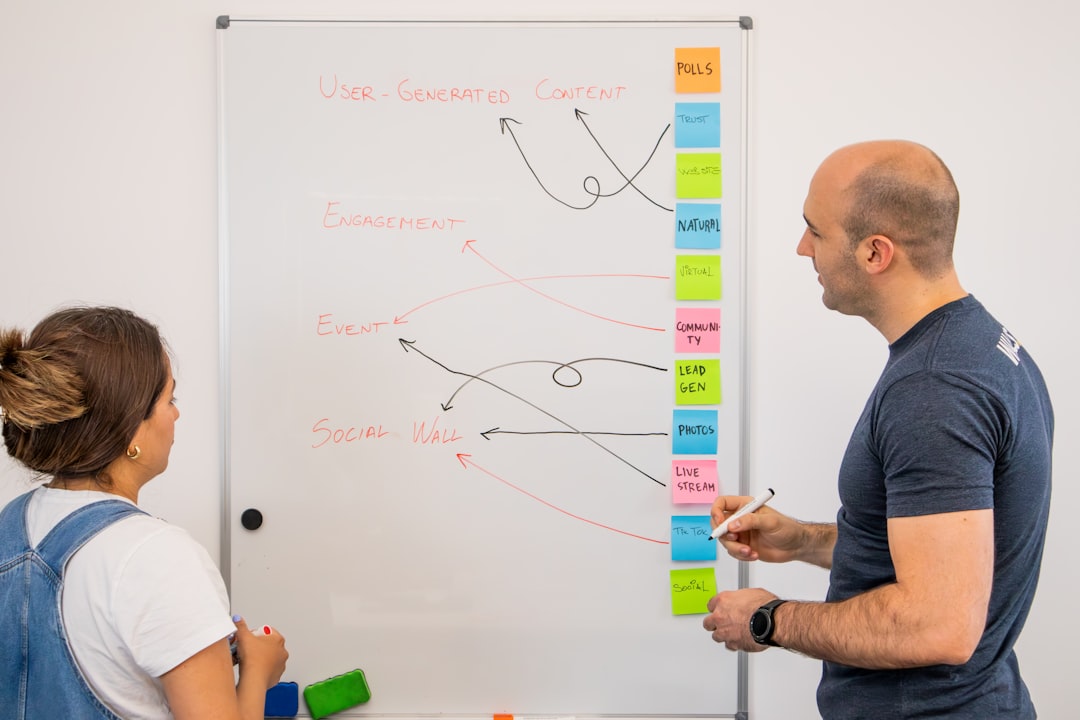
You’ve spent weeks, maybe months, planning every detail of your project. The logic is sound, the resources are allocated, and you know exactly how to get from point A to point B. Then comes the meeting. You pull up a slide with a massive, sprawling Gantt chart—a sea of overlapping bars, tiny text, and colors that don't seem to mean anything to anyone but you.
Within three minutes, you see the glazed-over look in your stakeholders' eyes. One executive frowns, someone else starts checking their phone, and then comes the dreaded question: "Can you just tell me when this will actually be done?"
It’s a frustrating moment because you have the answer. The answer is right there on the screen. But it's buried under a layer of complexity that makes the information inaccessible. When stakeholders can't quickly grasp the timeline, they stop trusting the plan. They don't see a strategic roadmap; they see a confusing mess. That's how you lose buy-in.
The problem isn't your planning; it's your presentation. Most project management tools are built for the person doing the work, not the person funding the work. There is a massive gap between a technical project schedule and a narrative timeline. If you can't bridge that gap, you're fighting an uphill battle every time you ask for more budget, more time, or more headcount.
Why Traditional Project Timelines Fail Stakeholders
To fix the problem, we have to understand why the "standard" way of showing progress often fails. For years, the Gantt chart has been the gold standard. While it's great for a project manager tracking dependencies and critical paths, it's often a nightmare for a stakeholder.
The Cognitive Load Problem
Stakeholders usually have a limited amount of "cognitive bandwidth" for your specific project. They are managing ten other things. When you present a timeline that requires them to squint at a legend or track a line across fifty columns, you're asking them to do too much mental work. Once the brain feels overwhelmed by a visual, it naturally shuts down or becomes skeptical. They aren't rejecting your project; they're rejecting the effort required to understand it.
Loss of Narrative
Projects aren't just a series of dates; they are stories. There is a beginning (the problem), a middle (the execution), and an end (the value delivered). Traditional charts treat every task with equal visual weight. A "Weekly Status Sync" looks the same as "Final Product Launch." When the milestones are buried among the minutiae, the story disappears. Your stakeholders lose sight of the "why" because they are too distracted by the "what."
The Static Nature of PDFs and Slides
Sending a static PDF of a timeline is where information goes to die. By the time the stakeholder opens the attachment, the data might already be old. Even worse, static images don't allow for exploration. A stakeholder might want to know more about a specific phase, but they can't click into it. They have to email you, wait for a response, and then schedule another call. This friction kills momentum.
The Psychology of Visual Storytelling in Business
If you want buy-in, you have to stop thinking like a scheduler and start thinking like a storyteller. Humans are wired to understand chronological sequences better when they are presented as a journey rather than a spreadsheet.
Creating a "Mental Map"
A good timeline creates a mental map. It allows a stakeholder to instantly see where the project stands today relative to the start and the finish. This "spatial" understanding of time is much more intuitive than reading a list of dates. When you can visually represent the distance between milestones, you communicate the scale of the effort without saying a word.
The Power of Interactivity
Imagine the difference between reading a map and using GPS. A map shows you everything, which can be overwhelming. GPS shows you where you are and what the next turn is, but lets you zoom out if you want to see the whole route.
Interactive timelines function like GPS for your project. You can provide a high-level view for the C-suite, but allow the project lead to click into a specific milestone to see the supporting documents, the team involved, and the specific deliverables. This "drill-down" capability ensures that no one is overwhelmed, but all the information is available.
Reducing Friction and Increasing Trust
Trust is built on transparency and clarity. When a stakeholder feels they "get it," they feel in control. When they feel confused, they feel an instinctive need to micromanage. By simplifying the visual delivery of your project timeline, you aren't "dumbing it down"—you're removing the barriers to trust. You're showing them that the project is under control and that the path forward is clear.
How to Design a Timeline That Actually Wins Approval
Creating a timeline that resonates requires a shift in perspective. You need to move away from "What do I need to track?" toward "What do they need to see?"
Identify the Key Milestones
Not every task is a milestone. A common mistake is listing every single deliverable on the main timeline. This creates noise.
Instead, identify the "Value-Added Milestones." These are the points where the project reaches a state that provides actual value or significantly reduces risk.
- Bad Milestone: "Drafted initial requirements document."
- Good Milestone: "Stakeholder sign-off on project scope."
Focus on the events that change the state of the project. By limiting the number of points on your main line, you create breathing room and draw the eye to what actually matters.
Use Color and Visual Hierarchy Strategically
Colors should never be arbitrary. If you have five different colors on your timeline, they should represent five distinct categories (e.g., Design, Development, QA, Marketing, Legal).
If you use red, it should almost always mean "Risk" or "Critical Path." If you use green, it should mean "Completed." When you establish a visual language and stick to it, stakeholders start to "read" your timelines subconsciously. They no longer need the legend because the colors tell the story.
Incorporate Rich Media for Context
A date and a title are rarely enough. To truly get buy-in, you often need to provide evidence or context. This is where interactive elements become a game-changer. Instead of saying "Prototype Complete," imagine if the stakeholder could click that milestone and immediately see a screenshot of the prototype, a link to the Figma file, or a short video demo.
By embedding media directly into the timeline, you turn a schedule into a portfolio of progress. You aren't just telling them you're on track; you're showing them the work.
Moving From Spreadsheets to Specialized Tools
For a long time, we've relied on Excel or PowerPoint to build timelines. Let's be honest: those tools were not made for this.
Excel is for data calculation. PowerPoint is for static presentations. When you try to force a project timeline into these tools, you spend 80% of your time fighting with the formatting—stretching boxes, aligning arrows, and fixing fonts—and only 20% of your time actually thinking about the project's strategic flow.
The "Formatting Trap"
We've all been there. You spend two hours making a slide look "perfect," only for the client to ask for one date change. Now, you have to move every single box on the slide to maintain the spacing. It's a waste of professional time.
A dedicated timeline tool separates the data (the dates and events) from the design (the layout and colors). When you change a date in a proper system, the visual updates automatically. This allows you to be agile. You can pivot the plan in seconds and present the update immediately, rather than spending your evening tweaking a slide deck.
Why Interactivity Beats the Static Slide
When you use a tool like Timeline Creator, you move from a static image to a living document. You can embed these timelines directly into your company wiki, your project dashboard, or a shared website.
The benefit here is twofold:
- Single Source of Truth: There is no "Version 3_Final_Updated_v2.pdf." There is just the link. Everyone always sees the most current version of the plan.
- Self-Service Information: Stakeholders can explore the timeline on their own time. They can zoom in on the phase they care about and ignore the rest.
Step-by-Step: Transforming a Confusing Chart into a Narrative Timeline
If you have a messy project plan right now, here is how to strip it down and rebuild it for maximum stakeholder impact.
Step 1: The "Value" Audit
Go through your current task list. Ask yourself: "If I removed this item from the timeline, would a VP care?" If the answer is no, move it to a secondary "Implementation List" and keep it off the primary visual timeline. You want to highlight the peaks, not every single step of the climb.
Step 2: Define Your Phases
Group your milestones into logical phases. Instead of a long line of 50 events, create 4–5 overarching phases (e.g., Discovery, Build, Validation, Launch). This gives the reader a framework to categorize the information. It's much easier to remember "We are currently in the Validation phase" than to remember "We are on task 24 of 60."
Step 3: Establish a Visual Theme
Choose a professional theme that matches your brand but prioritizes readability. Avoid overly bright, neon colors that distract from the content. Use a clean, high-contrast layout where the timeline axis is clear and the milestones are easy to distinguish.
Step 4: Add the "Evidence" Layer
For every major milestone, attach a piece of supporting evidence.
- For a "Market Research" milestone $\rightarrow$ attach the PDF of the research summary.
- For a "Technical Architecture" milestone $\rightarrow$ attach the system diagram.
- For a "Beta Launch" milestone $\rightarrow$ attach a link to the staging environment.
Step 5: Test for "The 10-Second Rule"
Show your new timeline to someone who isn't on the project. Give them 10 seconds to look at it. Then ask them:
- When does the project end?
- What phase are we in right now?
- What is the next big win?
If they can't answer those three questions in 10 seconds, your timeline is still too complex. Simplify further.
Common Mistakes That Kill Stakeholder Confidence
Even with the right tools, it's easy to fall back into habits that confuse your audience. Avoid these common pitfalls.
Mistake 1: The "Perfect World" Fallacy
Presenting a timeline where every bar is perfectly aligned and there is zero overlap or buffer. Experienced stakeholders know this isn't how the real world works. A timeline that looks "too perfect" feels dishonest.
The Fix: Build in visible buffers or "contingency windows." When you show a range of dates for a complex milestone rather than a single day, you signal that you've accounted for risk. This actually increases confidence because it shows you're a realist.
Mistake 2: Over-reliance on Jargon
Using internal technical terms on a stakeholder timeline. "API Integration Phase" might make sense to the dev team, but to the CFO, it's just noise.
The Fix: Translate technical milestones into business outcomes. Instead of "API Integration," use "System Connectivity & Data Flow." Speak the language of the person who is signing the checks.
Mistake 3: Ignoring the "Current Date" Marker
Providing a timeline without a clear "You Are Here" marker. Without a current date line, the stakeholder has to do the math to figure out if you're ahead of or behind schedule.
The Fix: Always use a bold, vertical "Today" line. This instantly provides a reference point for all other dates on the screen.
Mistake 4: Constant Manual Updates
Trying to keep a complex PowerPoint timeline updated manually. Eventually, you'll stop doing it because it's too tedious, and then you'll show up to a meeting with a timeline that is three weeks out of date.
The Fix: Use a web-based platform like Timeline Creator. Since it's integrated and editable in real-time, the "cost" of an update is seconds, not hours.
Comparing Tool Options: Which One is Right for You?
Depending on your role and the size of your project, different tools serve different purposes. It's important to distinguish between management tools and presentation tools.
| Tool Type | Examples | Best For... | The Downside |
| :--- | :--- | :--- | :--- |
| Project Management (PM) | Jira, Asana, Monday.com | Daily task tracking, resource allocation, developer workflow. | Often visually cluttered; "too much data" for executives. |
| General Purpose | Excel, PowerPoint, Google Slides | Quick internal notes, very simple schedules. | High manual effort to update; static; not interactive. |
| Visual Timeline Tools | Timeline Creator | Stakeholder buy-in, roadmaps, storytelling, public-facing updates. | Focused on narrative and visuals rather than granular task lists. |
The most successful project managers use a combination. They use Jira or Asana to manage the "weeds" of the project, but they use Timeline Creator to present the "forest" to their stakeholders. This prevents the stakeholders from getting bogged down in the daily chaos while ensuring they are completely aligned with the strategic direction.
Advanced Strategies: using AI to Speed Up Your Planning
We've entered an era where you don't have to start your timeline from a blank page. AI-powered generation is changing how we organize chronological data.
Automating the Structure
The hardest part of creating a timeline is often the initial organization. You have a list of 100 tasks and you aren't sure how to group them into a narrative. AI can help by analyzing your project description and suggesting a logical structure.
For example, if you describe a new product launch, an AI-integrated tool can automatically suggest phases like "Concept," "Prototyping," "Beta Testing," and "Go-to-Market." It transforms your raw data into a draft structure in seconds.
Refining the Narrative
AI can also help you translate "dev-speak" into "board-speak." If you have a technical milestone like "Refactoring the legacy database schema," you can use AI to suggest a more business-centric term like "Optimizing Data Infrastructure for Scalability."
The Human Touch
While AI can handle the structure and the phrasing, the strategy still requires a human. AI doesn't know that your CEO is particularly obsessed with the "Customer Onboarding" experience or that the Legal department is currently backlogged. Use AI to build the skeleton, but use your professional judgment to add the nuance.
Real-World Scenarios: Applying These Principles
To see how this works in practice, let's look at three different professional scenarios.
Scenario 1: The Product Roadmap (UX Designer)
A UX designer at a company like Circooles needs to show the product roadmap for the next three quarters. A Gantt chart would be too detailed. Instead, they use Timeline Creator to build an interactive roadmap.
They create three main lanes: "User Experience," "Technical Infrastructure," and "Market Expansion." When the Product Manager clicks on the "User Experience" milestone for Q2, a popup appears showing the wiredrames for the new dashboard. The stakeholders don't just see a date; they see the vision. Buy-in is achieved because the value is visible.
Scenario 2: The Project Milestone Report (Product Manager)
A PM at a firm like Sisyphus has a project that has hit a few snags. They have a meeting with stakeholders who are starting to get nervous. Instead of a spreadsheet showing "delayed" tasks in red, the PM creates a narrative timeline.
They highlight the achievements of the last month first, then clearly mark the "Current Blockers" as a specific phase on the timeline. They attach a brief explanation and a proposed solution to those blockers. By framing the delay within the context of the overall journey, the PM manages the narrative. The stakeholders see that the delay is a known variable being managed, not a sign of failure.
Scenario 3: The Educational Narrative (History Teacher)
While not a business project, the principles of stakeholder buy-in apply to students. A teacher at Lincoln High School finds that students are bored by a list of dates in a textbook.
The teacher uses Timeline Creator to build an interactive timeline of the Industrial Revolution. Students can click on "The Steam Engine" to see a video of how it works or click on a date to see a primary source document from a factory worker. By turning a list of dates into an interactive exploration, the teacher gains "buy-in" from the students, leading to higher engagement and better learning outcomes.
Checklist: Is Your Timeline Ready for the Boardroom?
Before you send that invite or share that link, run through this final checklist to ensure your timeline is a tool for persuasion, not a source of confusion.
- [ ] The 10-Second Test: Can a stranger identify the end date and current phase in 10 seconds?
- [ ] Value-Based Milestones: Did I remove the "noise" and keep only the high-value events?
- [ ] Visual Logic: Do the colors have a consistent meaning throughout the document?
- [ ] Evidence Attached: Are the major milestones linked to supporting documents or media?
- [ ] Outcome-Oriented Language: Did I replace technical jargon with business value?
- [ ] The "You Are Here" Marker: Is the current date clearly visible?
- [ ] Accessibility: Is the timeline embedded or linked so that it's always up-to-date?
- [ ] Buffer Zones: Have I shown realistic time-frames instead of "perfect" single dates?
FAQ: Mastering Project Timelines
Q: How often should I update my stakeholder timeline?
A: It depends on the project's pace, but the goal should be "real-time" or "near real-time." If you use a tool like Timeline Creator, you can update it as changes happen. This prevents the "shock" of a major update during a monthly meeting. If you provide a live link, stakeholders can check it whenever they want, reducing the number of "status check" emails you receive.
Q: What do I do if a project is significantly behind schedule?
A: Don't hide it, but don't lead with a "red" spreadsheet. Instead, use your timeline to show the impact of the delay. Adjust the remaining milestones and show the new projected end date. Use the interactive features to attach a "Recovery Plan" to the affected milestone. Showing that you have a plan to get back on track is more important than the fact that you've slipped.
Q: Should I include every team member's name on the timeline?
A: Generally, no. For high-level stakeholder buy-in, names are noise. Focus on the role or the department responsible for the milestone. If they want to know who is doing the work, they can click into the milestone to see the project team. Keep the main view focused on the "what" and "when."
Q: How do I handle a project with too many dependencies to simplify?
A: This is where you distinguish between your working document and your presentation document. Your working document (like a Gantt chart) needs every dependency. Your presentation timeline should group those dependencies into a "Phase." Instead of showing ten arrows pointing to one box, just call that phase "Integrated Testing." The stakeholders don't need to see the wires; they just need to know the machine works.
Q: Is a timeline better than a slide deck for a project pitch?
A: A timeline is a powerful part of a pitch, but it doesn't replace the pitch. Use slides to sell the vision and the "why," but use a timeline to prove the "how" and "when." A link to an interactive timeline is a great way to end a presentation, giving the stakeholders something tangible to explore after you've finished speaking.
Final Thoughts: The Path to Better Buy-In
At the end of the day, project management is as much about communication as it is about organization. You can be the most organized person in the world, but if you cannot communicate that organization to the people who hold the resources, your project is at risk.
Confusion is the enemy of approval. When a stakeholder is confused, they hesitate. When they hesitate, they ask for more meetings, more reports, and more justifications. This creates a cycle of friction that slows down your project and drains your energy.
By shifting your focus from "listing tasks" to "telling a story," you remove that friction. When you use interactive, visually clean timelines, you are doing more than just sharing a schedule—you are building confidence. You are showing your stakeholders that you have a clear vision, a realistic plan, and the professional tools to execute it.
Stop fighting with cells in a spreadsheet and stop worrying about aligning boxes in a slide deck. Use a tool designed for the job. With Timeline Creator, you can transform your complex project data into a beautiful, interactive narrative that doesn't just inform your stakeholders—it wins them over.
Ready to stop the confusion and start getting the buy-in your project deserves? Head over to Timeline Creator and turn your project plan into a visual success story today.
