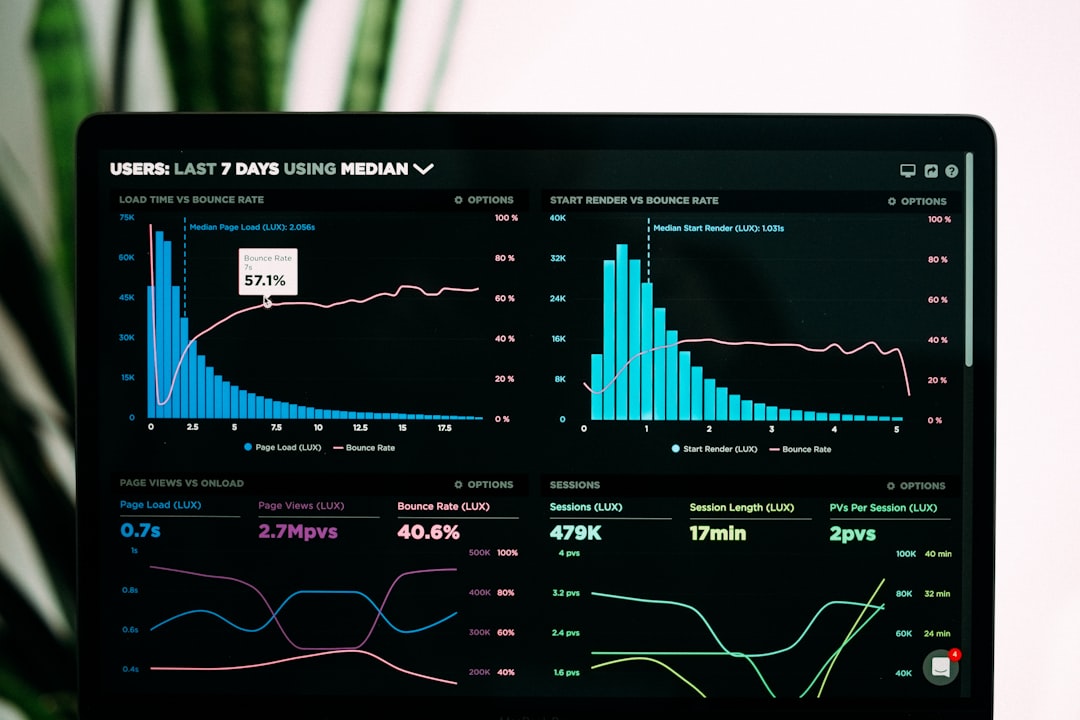
We’ve all been there. You’re sitting in a meeting, or maybe you're a student in a lecture, staring at a slide filled with a bulleted list of dates. 1924: This happened. 1932: That happened. 1945: Something else happened. It’s dry. It’s static. And honestly, it’s where attention goes to die. When we present information as a simple list of chronological events, we aren't telling a story; we're just reading a ledger.
The problem is that humans aren't wired to remember lists. We are wired for narratives. We remember the why and the how—the connections between events—far better than the specific date on a calendar. When you strip away the visual context and the interactivity from your data, you lose the emotional punch and the logical flow that makes information stick. This is why so many project roadmaps are ignored by stakeholders and why history classes can feel like a slog through a textbook.
But there is a better way. The shift from static lists to interactive stories is where the magic happens. Imagine instead of a slide, you have a living, breathing timeline. A user can scroll through a journey, click on a milestone to see a video of the product launch, or dive deeper into a historical event through an embedded gallery of photos. This is the difference between telling someone about a process and letting them experience it.
With the rise of AI, this transition has become even easier. You no longer need a degree in graphic design or ten hours of free time to build something that looks professional. AI-powered timeline tools can now take a raw dump of data and organize it into a coherent structure, leaving you to focus on the storytelling. Whether you are a project manager trying to keep a team on track or a teacher trying to spark curiosity in a classroom, transforming your data into interactive stories is the most effective way to ensure your message actually lands.
Why Static Timelines Fail to Engage Your Audience
Before we get into how to fix the problem, we need to understand why the traditional approach fails. For decades, the "timeline" has been a line on a piece of paper or a slide with a few dots and labels. While this works for a quick glance, it fails the moment you need to convey complexity.
The Cognitive Load Problem
When you present a dense, static timeline, you're asking your audience to do a lot of heavy lifting. They have to scan the entire line, hold the dates in their head, and try to mentally map the distance between events. If there are too many points, the visual becomes cluttered. If there are too few, it feels empty. This creates "cognitive overload," where the brain stops trying to process the information because it's simply too much to take in at once.
The Lack of Depth
A static image is a snapshot. It can only show one layer of information. If you want to provide more detail about a specific milestone—perhaps a link to a technical document or a detailed explanation of a failure and subsequent pivot—you have to add more text to the slide. This leads to the dreaded "wall of text," which is the fastest way to make an audience tune out.
The Directional Blindness
Static timelines often feel like they are just moving from left to right. There's no sense of momentum or causality. In the real world, events don't just happen in a sequence; they influence one another. One project delay causes a ripple effect across three other milestones. A political event in one country triggers a revolution in another. Static lines struggle to show these interdependencies, making the data feel disjointed and robotic.
The Power of Interactive Visual Storytelling
Interactive storytelling changes the relationship between the viewer and the data. Instead of being a passive observer, the viewer becomes an active participant. This shift is a psychological game-changer.
Active Learning and Retention
When a user clicks a point on a timeline to reveal more information, they are engaging in "active discovery." This process signals to the brain that the information is important. By controlling the pace of the information delivery, the user can digest one milestone before moving to the next. This significantly increases retention rates compared to being bombarded with a full screen of data.
Layering Information for Different Audiences
One of the biggest challenges in professional communication is speaking to different levels of stakeholders simultaneously. Your CEO wants the high-level milestones (the "big picture"), but your engineering lead needs the granular details (the "how").
Interactive timelines allow you to layer information.
- Layer 1 (The Overview): A clean, high-level line with major dates.
- Layer 2 (The Detail): Clickable elements that expand into descriptions, images, or videos.
- Layer 3 (The Evidence): Links to external documents, spreadsheets, or archived records.
This means one single interactive asset can serve as a presentation tool for executives and a project manual for the team.
Creating an Emotional Connection
Data is cold, but stories are warm. By adding rich media—a voice memo from a founder, a photo of a prototype, or a short clip of a historical speech—you add a human element to the chronology. You aren't just showing that a milestone was hit; you're showing the effort, the struggle, and the victory associated with it.
How AI is Revolutionizing Timeline Creation
For a long time, creating a high-quality interactive timeline required specialized software or a lot of manual coding (think HTML/CSS and JavaScript libraries). Most people just gave up and went back to PowerPoint. This is where AI enters the picture.
Automating the Structure
The hardest part of building a timeline isn't the design—it's the organization. Sorting through a mountain of notes, dates, and events to create a logical flow is tedious. AI-powered generation can now take a rough set of notes or a project description and suggest a chronological structure. It identifies the key milestones and organizes them in a way that makes sense, effectively acting as a first-draft editor for your history.
Rapid Prototyping of Narratives
Usually, if you want to test a different way of telling a story, you have to rebuild the entire visual. AI allows you to iterate quickly. You can ask the tool to "simplify this project roadmap for a client presentation" or "expand this historical timeline to include more socio-economic factors," and the AI can adjust the framework of the timeline in seconds.
Bridging the Design Gap
Not everyone is a designer. Most of us struggle with color palettes, spacing, and font choices. AI-integrated platforms, like Timeline Creator, provide professional themes that automatically apply design principles. The AI ensures that the visual hierarchy is correct—meaning the most important dates stand out and the layout remains clean regardless of how much data you add.
Practical Applications: Who Can Benefit from Interactive Timelines?
Interactive timelines aren't just for historians. The utility of a chronological visual narrative spans almost every professional and academic field.
For Project Managers and Product Teams
In the corporate world, the "roadmap" is a constant point of contention. Gantt charts are great for internal tracking, but they are often too complex for stakeholders.
- Product Roadmaps: Instead of a spreadsheet, use an interactive timeline to show the evolution of a feature. You can embed screenshots of early wireframes and link to the final live product.
- Onboarding New Hires: Imagine a new employee joining your company. Instead of a handbook, give them an interactive timeline of the company's history. They can see the pivotal pivots, the growth spurts, and the culture shifts that shaped the organization.
- Stakeholder Reporting: When presenting a quarterly update, an interactive timeline allows you to show exactly where you are in the project lifecycle and what the "win" was for each phase.
For Educators and Students
History is often taught as a series of dates to be memorized for a test. This kills the joy of the subject.
- Classroom Engagement: Teachers can create a "living history" timeline where students contribute their own findings. One student might add a primary source document about the Industrial Revolution, while another adds a video analysis of the social impacts.
- Student Projects: Instead of a 10-page essay, students can build an interactive narrative. This forces them to synthesize information, decide what is most important, and think about how events are linked.
- Complex Subject Mapping: Timelines aren't just for history. They can be used in science to show the evolution of a theory or in literature to map a character's journey through a novel.
For Content Creators and Marketers
In the age of "scrolling," you have about three seconds to capture someone's attention. A wall of text won't do it.
- Brand Storytelling: An "About Us" page is usually a boring paragraph. An interactive timeline that shows the brand's journey from a garage startup to a global player is far more compelling.
- Event Promotion: Leading up to a major launch or conference, a countdown timeline can build anticipation, revealing new details and speakers as the dates approach.
- Case Studies: Instead of a PDF, present a client success story as a timeline: The Problem $\rightarrow$ The Strategy $\rightarrow$ Implementation $\rightarrow$ Results.
Step-by-Step: How to Build an Engaging Interactive Story
If you're new to this, the prospect of "storytelling with data" can feel overwhelming. Here is a practical workflow to go from a messy pile of data to a polished, interactive timeline.
Step 1: Define Your "North Star"
Before you touch any tool, ask yourself: What is the one thing I want the viewer to understand?
- If you're showing a project roadmap, the goal might be "Confidence in our delivery date."
- If you're showing a historical event, the goal might be "Understanding the causes of the conflict."
If you try to include every single piece of data, you'll create a cluttered mess. Be ruthless. If a date doesn't serve the main narrative, leave it out.
Step 2: Gather and Categorize Your Assets
A timeline is only as good as its media. Start a folder for each major milestone.
- Text: A short headline and a 2-3 sentence summary.
- Visuals: Photos, icons, or short video clips.
- Links: Documentation, sources, or deeper reads.
Categorizing these early prevents the "stop-and-start" frustration that happens when you're in the middle of the design process and realize you're missing a key image.
Step 3: Map the Logical Flow (The Skeleton)
List your events in order. Now, look for the gaps. Is there a jump of five years where nothing seems to happen? Is there a cluster of ten events in one month?
- Cluster events into "chapters" or "phases" to make the timeline easier to navigate.
- Identify the "Climax": Every story has a turning point. Make sure that milestone is visually distinct (e.g., a larger icon or a different color).
Step 4: Use a Tool Like Timeline Creator to Build
Now you move into the execution phase. This is where you leverage the platform to do the heavy lifting.
- Upload your data: Use the AI-generation tools to set up the basic structure.
- Apply a Theme: Choose a professional design that matches your mood (e.g., a sleek, dark theme for a tech roadmap or a clean, classic look for an academic project).
- Add the Interactivity: This is where you embed your media. Add the videos, the galleries, and the links.
Step 5: Test and Refine
View your timeline on different devices. Does it work on a mobile phone? Is the text readable? Ask a colleague or a student to look at it without explanation. If they get confused about the sequence of events, you need to simplify your labels or adjust the flow.
Common Mistakes to Avoid When Creating Timelines
Even with great tools, it's easy to fall into a few traps that can make your timeline feel clunky or confusing.
1. The "Everything is Important" Trap
The most common mistake is trying to put every single date into the timeline. When everything is highlighted, nothing is highlighted.
Fix: Use a hierarchy. Only put the major milestones on the main line. Put the minor details inside the clickable " expandable" sections.
2. Overloading the Visuals
While rich media is great, too many flashing colors or oversized images can distract from the actual data. If every single point has a giant video that auto-plays, the user will feel overwhelmed.
Fix: Use consistent iconography. Use a standard size for your images. Keep the palette limited to 3-4 complementary colors.
3. Ignoring the "White Space"
White space (or negative space) is your best friend. It gives the viewer's eyes a place to rest. If your markers are crammed together, the timeline feels claustrophobic.
Fix: Use the spacing tools in your software to ensure there's breathing room between events. If you have a dense period of time, consider using a "zoom" feature or breaking the timeline into themed sections.
4. Forgetting the Call to Action (CTA)
If you've built a timeline for a business purpose, don't just let it end. What should the viewer do after seeing the journey?
Fix: End your timeline with a clear next step. "Schedule a demo," "Download the full report," or "Join the discussion."
Comparison: Static vs. Interactive vs. AI-Generated Timelines
To help you decide which approach is right for your current project, let's look at how they stack up against each other.
| Feature | Static Timeline (PPT/PDF) | Interactive Timeline (Manual) | AI-Powered Interactive Timeline |
| :--- | :--- | :--- | :--- |
| Time to Create | Low (Initial) / High (Updates) | High | Low to Medium |
| User Engagement | Passive (Reading) | Active (Exploring) | Active (Exploring) |
| Depth of Info | Surface Level | Deep (Layered) | Deep (Layered) |
| Flexibility | Rigid | Flexible | Extremely Flexible |
| Design Quality | Variable (Depends on User) | High (If skilled) | High (Template-driven) |
| Maintenance | Hard (Must edit slide/export) | Medium (Update in tool) | Easy (AI can suggest updates) |
A Deep Dive into Team Collaboration for Timelines
When you're working in a corporate or educational setting, a timeline is rarely a solo project. It's usually a collaborative effort. This is where the process often breaks down—everyone has a different version of the "latest" PowerPoint file.
The "Version Control" Nightmare
We've all seen it: Project_Roadmap_v1_final.pptx, Project_Roadmap_v2_final_UPDATED.pptx, Project_Roadmap_v3_USE_THIS_ONE.pptx. It's a mess. When you move to a web-based platform like Timeline Creator, you eliminate this entirely. There is one "source of truth." When a date changes, it updates for everyone watching the timeline in real-time.
Real-Time Feedback Loops
Instead of sending a timeline in an email and waiting for a flurry of "can we change this date?" replies, collaboration tools allow for inline comments.
- Suggestions: A team member can highlight a milestone and suggest, "I think we should move this to October based on the new vendor contract."
- Shared Editing: Multiple people can contribute data simultaneously. The historian provides the dates, the archivist uploads the photos, and the editor polishes the text.
Accountability and Transparency
For project managers, a shared interactive timeline acts as a public contract. When the roadmap is visible to the whole team (and the stakeholders), there's a natural increase in accountability. Everyone knows where the project stands and what the upcoming hurdles are.
Case Studies: Real-World Transformations
To see how this actually works in practice, let's look at three different scenarios where transforming boring data into an interactive story changed the outcome.
Scenario A: The Struggling History Classroom
The Problem: A high school history teacher noticed that students were failing their units on the French Revolution. The students could recite dates, but they didn't understand the causality—how atmospheric tension led to the storming of the Bastille, which led to the Reign of Terror.
The Solution: The teacher shifted from lectures to a collaborative interactive timeline project. Students were split into groups; one group focused on the economic crisis, another on the Enlightenment thinkers, and another on the monarchy.
The Result: Because students were building the "story" themselves and linking the events with rich media, they stopped seeing history as a list and started seeing it as a chain reaction. Test scores improved, but more importantly, student engagement skyrocketed.
Scenario B: The "Invisible" Project Roadmap
The Problem: A Product Manager at a mid-sized tech company was struggling to get buy-in from the executive board. Every time he presented the roadmap in a slide deck, the executives would interrupt to ask for a detail that was "somewhere in the appendix," breaking the flow of the presentation.
The Solution: He replaced the slides with a high-level interactive timeline. During the meeting, he kept the view zoomed out to show the quarterly goals. When an executive asked for a specific detail, he simply clicked the milestone, and the detailed specs and risk assessments popped up instantly.
The Result: The presentation time was cut in half, and the executives felt more confident in the plan because they could see the depth of the research without being overwhelmed by it.
Scenario C: The "About Us" Bounce Rate
The Problem: A boutique marketing agency found that visitors to their "About" page were leaving within seconds. The page was a long, generic essay about their "passion for excellence" and "commitment to clients."
The Solution: They scrapped the essay and built an interactive journey of the agency. They started with the founders' first failed business in 2012, their first big win in 2015, and the key pivots they made along the way. They added candid photos of the team and clips of their favorite campaigns.
The Result: The time spent on the "About" page increased by 400%. Potential clients felt they "knew" the agency before the first discovery call, leading to a higher conversion rate.
Advanced Tips for Scaling Your Visual Narratives
Once you've mastered the basics, you can start using more advanced techniques to make your timelines even more effective.
Using "Thematic" Color Coding
Don't just use colors because they look pretty. Use them to categorize information.
- Green: Wins/Achievements
- Red: Obstacles/Pivots
- Blue: Planning/Research
When a user looks at the timeline, they can instantly see the "mood" of the project without reading a single word. A lot of red in the middle of a timeline tells a story of struggle and resilience; a steady stream of green tells a story of rapid growth.
Integrating Dynamic Data
If you're in a fast-moving environment, you don't want to manually update your timeline every day. Look for ways to link your timeline to your project management software. While some tools are static, the trend is moving toward "live" timelines that reflect the current status of tasks in real-time.
Creating "Branching" Narratives
For advanced storytelling, consider the concept of "what if." While a standard timeline is linear, some interactive formats allow you to show alternative paths. For example, in a business case study, you could show the path the company took versus the path they didn't take, illustrating why the chosen strategy was the correct one.
Checklist: Is Your Timeline Ready for the World?
Before you hit "publish" or send that embed link to your boss, run through this final quality check.
- [ ] Objective Clear: Is the main goal of the story obvious within the first 10 seconds?
- [ ] Hierarchy Established: Are the major milestones visually distinct from the minor ones?
- [ ] Media Optimized: Do all images load quickly? Are videos short and relevant?
- [ ] Narrative Flow: Does the sequence of events lead logically to the conclusion?
- [ ] White Space: Is there enough breathing room to prevent cognitive overload?
- [ ] Mobile Responsive: Does it look and function well on a smartphone?
- [ ] CTA Included: Is there a clear next step for the viewer at the end?
- [ ] Fact-Checked: Are the dates and descriptions accurate?
FAQ: Everything You Need to Know About AI Timelines
Q: Do I need to know how to code to create an interactive timeline?
A: Not at all. Modern platforms like Timeline Creator are designed for non-technical users. If you can upload a photo and type a sentence, you can build a professional interactive timeline.
Q: How does AI help in the process? It sounds like it might take away the "storytelling" part.
A: Think of AI as your assistant, not the author. AI handles the boring parts—organizing raw dates, suggesting structures, and applying design templates. You still provide the insight, the emotional hooks, and the final editorial oversight. It speeds up the "grunt work" so you can spend more time on the narrative.
Q: Can I embed these timelines into my own website or blog?
A: Yes. Most professional timeline tools provide an embed code (similar to how you embed a YouTube video). This allows the timeline to live directly on your page, keeping users on your site longer and improving your SEO.
Q: Are interactive timelines better for SEO than a standard blog post?
A: Indirectly, yes. Google tracks "dwell time"—how long a user stays on your page. Because interactive timelines encourage clicking and exploring, users stay longer. This signals to search engines that your content is high-quality and engaging, which can help your rankings.
Q: Is it better to use a timeline for a project roadmap or a Gantt chart?
A: They serve different purposes. A Gantt chart is for internal execution (who is doing what and when). An interactive timeline is for communication (what are the milestones and why do they matter). Use the Gantt chart to manage the work and the timeline to present the progress.
Final Thoughts: Stop Listing, Start Storytelling
Data is everywhere. We are drowning in spreadsheets, calendars, and checklists. But data on its own is silent. It doesn't inspire, it doesn't persuade, and it certainly doesn't engage. To make people care about your project, your history, or your vision, you have to give that data a voice.
By moving away from static lists and embracing interactive, AI-enhanced storytelling, you bridge the gap between information and understanding. You stop asking your audience to do the hard work of imagining the connections and instead, you show them the journey in a way that is intuitive, visual, and memorable.
Whether you are trying to save a failing history class, win over a skeptical board of directors, or tell the story of your brand, the tool you use matters. Don't settle for a flat slide when you can provide an experience.
Ready to turn your boring data into a compelling narrative? Head over to Timeline Creator and start building your first interactive story today. Your audience will thank you for it.
